
SigNoz
SigNoz is an open source, OpenTelemetry-native observability platform combining metrics, logs, traces, and alerts.
 Datadog
 New Relic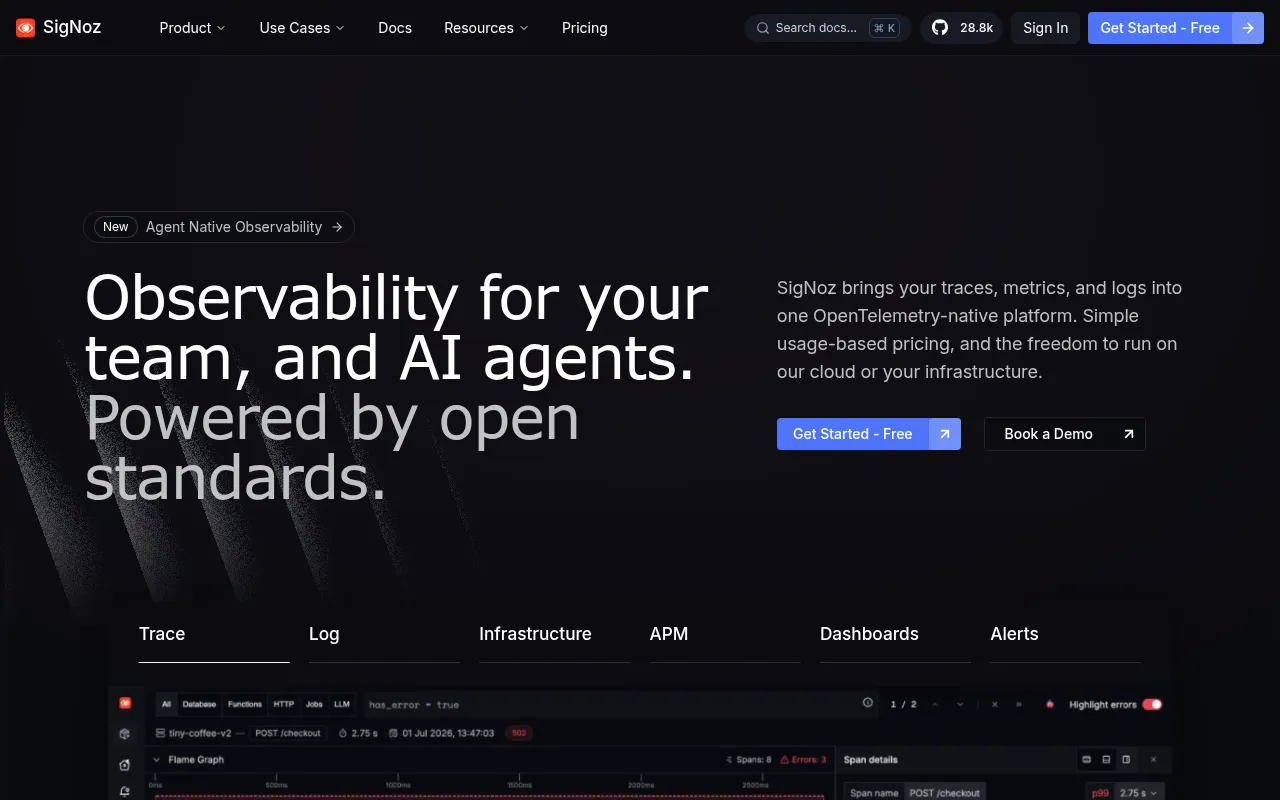
SigNoz is an open source observability platform built on OpenTelemetry that combines logs, metrics, traces, alerts, and dashboards in one tool. It's positioned as a self-hosted alternative to Datadog and New Relic, aimed at teams that want a single columnar database backing correlated telemetry instead of separate metrics, logging, and tracing tools with unpredictable per-host pricing. Community, Enterprise, and fully managed Cloud tiers are all built on the same codebase.
Key features
- OpenTelemetry-native ingestion: instrument once with the OpenTelemetry standard and avoid vendor-specific SDKs.
- APM dashboard: monitor service latency, error rate, throughput, Apdex, and database and external calls per service.
- Log management: ingest, search, and correlate logs with traces and metrics through a visual query builder.
- Distributed tracing: view flamegraphs and waterfall spans to follow a request across services.
- Infrastructure monitoring: track Kubernetes clusters, pods, nodes, and host-level CPU, memory, disk, and network metrics.
- Trace funnels: turn traces into funnels that surface where multi-step request flows drop off or fail.
- LLM and AI observability: trace LLM applications and RAG pipelines, including prompts, tool calls, tokens, latency, and cost.
How it works
SigNoz ingests telemetry through OpenTelemetry instrumentation, which sends traces, metrics, and logs from applications and infrastructure into a single columnar database rather than three separate systems. That shared storage layer is what lets the UI correlate a slow trace with the logs and metrics from the same time window and service, instead of pivoting between separate tools for each signal type.
Ideal use cases
SigNoz fits teams moving off a stack of single-purpose tools, such as Prometheus for metrics plus Jaeger for tracing plus a separate log aggregator, and want one system with correlated data instead. It's also used by teams that specifically want to avoid Datadog or New Relic's per-host or per-seat pricing models on high-volume workloads. In a published benchmark, SigNoz reports roughly 50% lower resource requirements than Elastic during log ingestion, and indexed all keys in a test where Loki hit max stream errors as more labels were added. SigNoz's own stated reasons teams adopt it include OpenTelemetry-native instrumentation, correlated signals across services and logs instead of separate dashboards, a single columnar database built for high-cardinality workloads, and pricing without per-host or per-seat fees. Documented integrations also cover Prometheus, Kubernetes, major cloud providers, language SDKs, application frameworks, and databases, alongside core exception tracking and alerting.
Self-hosting and deployment
SigNoz can be self-hosted with Docker, Kubernetes, or Linux, or run through the newer Foundry install path; a managed SigNoz Cloud option is also available with a 30-day free trial. The self-hosted community edition keeps the full data plane inside your own infrastructure, while Enterprise adds BYOC, custom retention, RBAC, and data residency options on top of the same core platform.
Frequently asked questions



Similar to SigNoz


