
Redash
Redash lets teams query 35+ SQL and NoSQL sources, build drag-and-drop visualizations, and share dashboards with scheduled refreshes.
 Looker
 Tableau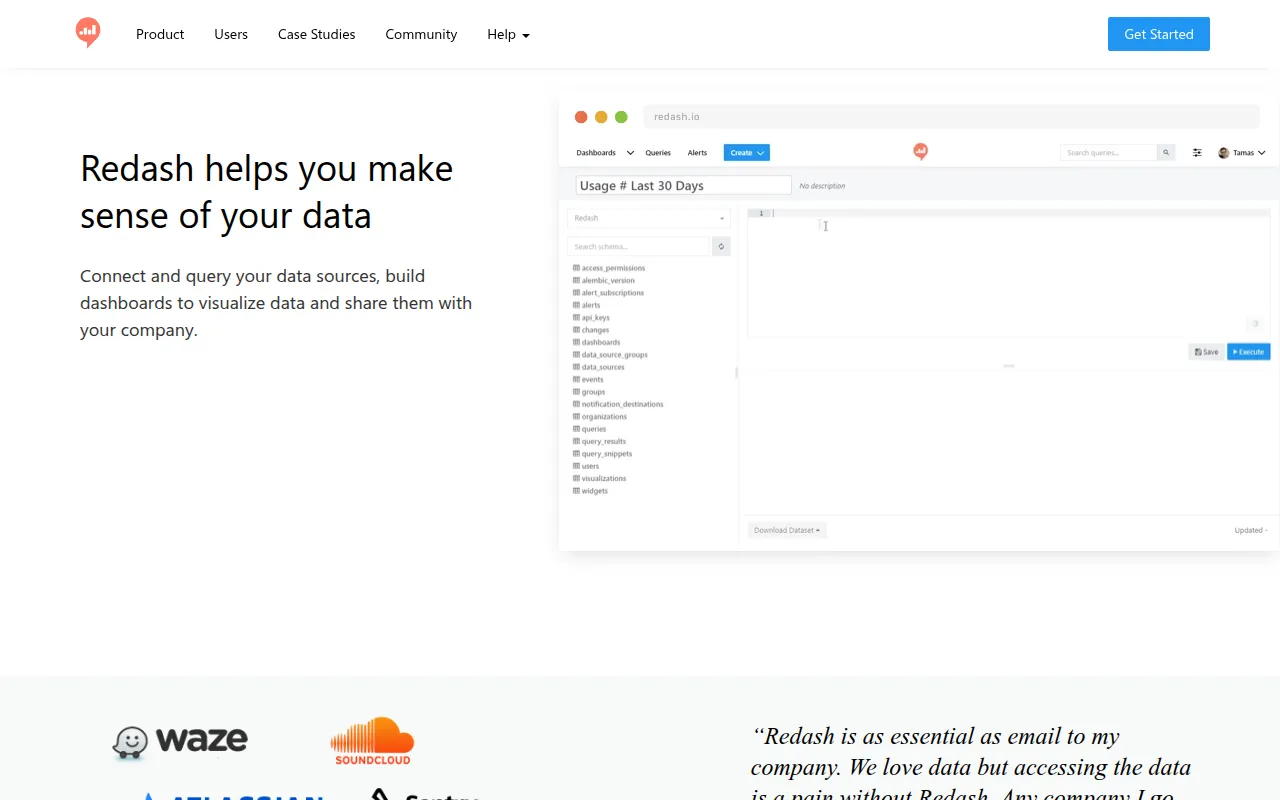
Redash is a browser-based tool for querying, visualizing, and sharing data from SQL and NoSQL sources, commonly positioned as an open source alternative to Tableau and Looker for teams that want dashboards built directly on top of their existing databases. Everything runs through the browser with a shareable URL, so a query and its visualizations can be reviewed by anyone with access, not just the person who wrote the SQL. The project states that millions of users at thousands of organizations use Redash to make data-driven decisions.
Key features
- 35+ built-in data source connectors: Amazon Redshift, Athena, BigQuery, Snowflake, PostgreSQL, MySQL, MongoDB, Elasticsearch, ClickHouse, CockroachDB, and more, with an extensible data source API for adding others.
- Query editor with schema browser: autocomplete and schema browsing speed up writing SQL and NoSQL queries without switching to a separate database client.
- Drag-and-drop visualizations and dashboards: combine multiple query visualizations into a single dashboard, then share it with a URL.
- Scheduled refreshes: charts and dashboards update automatically at a defined interval instead of requiring a manual re-run.
- Alerts: define a condition on a query result and get notified instantly when it's met.
- REST API: everything available in the UI, including queries and dashboards, is also accessible through the API for automation.
- Peer review workflow: sharing a query and its visualization lets other analysts review the SQL alongside the resulting chart.
Self-hosting and deployment
Redash setup instructions cover both self-hosted installs and ready-made AWS and GCE images, documented in the project's setup guide. The project is written primarily in Python, with CI running through GitHub Actions on every change. Security issues are handled through a dedicated [email protected] contact with an available PGP key for encrypted disclosure, rather than public issue reports.
Ideal use cases
Redash fits teams where SQL-literate analysts need to publish reusable queries and dashboards to non-technical stakeholders, since the query editor, visualization layer, and sharing model are all built around a shared, browser-based URL rather than a desktop BI client. It also supports scripted data sources like Python and Shell Scripts for cases that fall outside plain SQL, and the JIRA (JQL) and Google Analytics connectors extend it beyond pure database querying. Because every query and dashboard is reachable by URL, Redash also works as a lightweight way to hand off ad hoc analysis to engineering or product teams without exporting a spreadsheet, and the same URL can be embedded in an internal wiki or status page.
Community support runs through GitHub Issues for bugs, a GitHub Discussions board for general questions, and a Discord server for development discussion; a wiki page documents the local development setup for anyone forking the project to add a new data source or extend an existing connector.
Redash is licensed under BSD-2-Clause.
Tags:
Frequently asked questions






Similar to Redash


