
Beszel
Beszel is an open-source, lightweight server monitoring tool with Docker stats, historical data, and configurable alerts.
 Datadog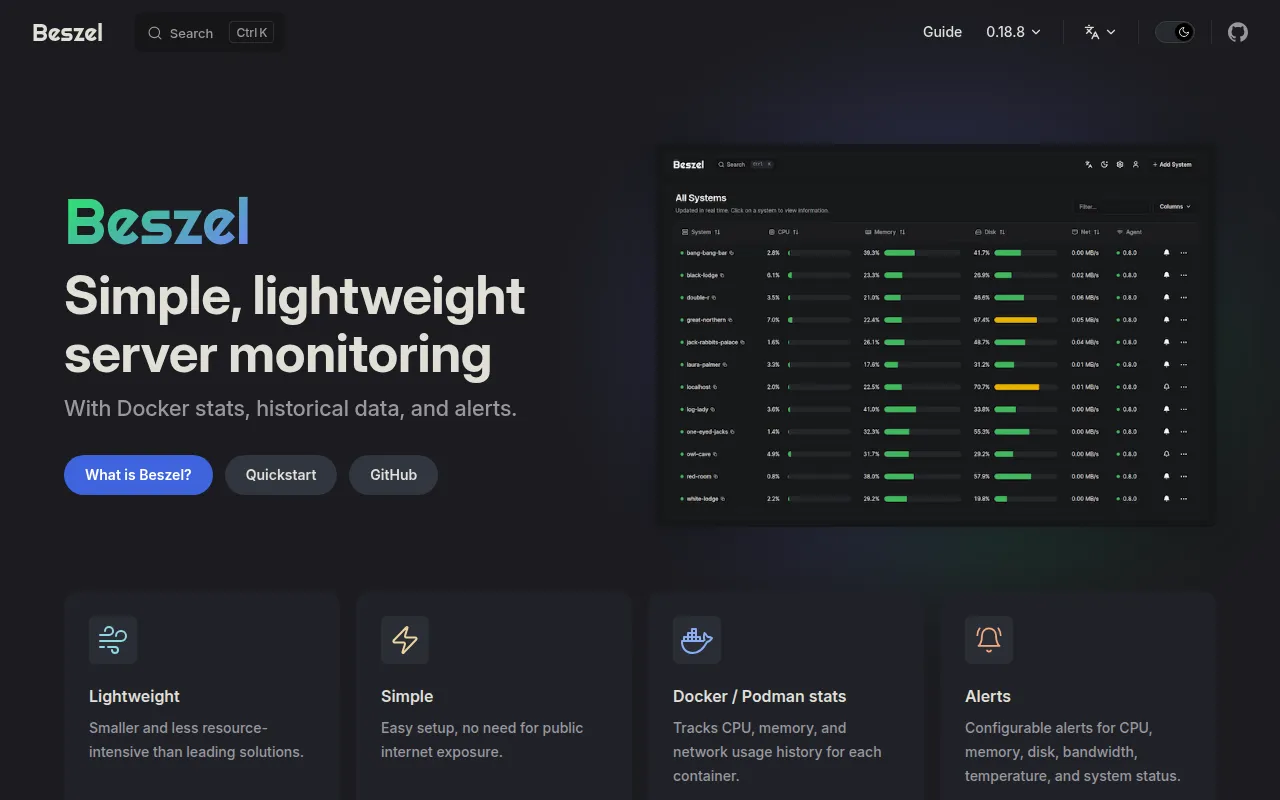
Beszel is a self-hosted server monitoring platform for people running homelabs or small fleets of servers who want a lightweight alternative to heavier monitoring stacks. It tracks CPU, memory, disk, network, and container metrics over time, with a web dashboard and alerting built in. It's aimed at anyone who wants visibility into their infrastructure without standing up a full Prometheus/Grafana setup.
Key features
- Lightweight: Smaller and less resource-intensive than many comparable monitoring solutions, so it runs fine on modest hardware.
- Simple setup: Works out of the box with minimal manual configuration.
- Docker stats: Tracks CPU, memory, and network usage history per container (Docker and Podman).
- Alerts: Configurable thresholds for CPU, memory, disk, bandwidth, temperature, fan speed, load average, and system status.
- Multi-user support: Each user manages their own systems, and admins can share systems across users.
- OAuth / OIDC: Supports multiple OAuth2 providers, and password authentication can be disabled entirely.
- Automatic backups: Back up to and restore from local disk or S3-compatible storage.
- Broad metric coverage: Disk I/O, load average, temperature, fan speed, GPU usage/power draw (Nvidia, AMD, Intel), battery charge, and S.M.A.R.T. disk health, including eMMC wear/EOL and Linux mdraid array health.
Ideal use cases
Beszel fits homelab operators and small teams who run a handful to a few dozen servers and want a dashboard showing system and container health without deploying a heavier observability stack. It's a good match if you want historical graphs for CPU, memory, disk, and network, plus alerting on thresholds like temperature or disk usage, and you'd rather not manage Prometheus, Grafana, and exporters separately.
It's also a reasonable choice if you need multi-user access control (each user sees only their own systems) or want to authenticate via an existing OAuth/OIDC provider instead of managing separate credentials.
It's probably not the right fit if you need deep application-level metrics, distributed tracing, log aggregation, or the extensibility of a full Prometheus/Grafana or Datadog-style stack. Beszel focuses on system and container-level metrics, not custom application instrumentation. If you're running large-scale infrastructure with complex alerting pipelines or need integration with a broader observability ecosystem, a more general-purpose toolchain will likely serve you better.
Installation
Beszel has two components: a hub (the web dashboard, built on PocketBase) and an agent (runs on each monitored system and reports metrics back to the hub).
The README points to the official quick start guide for full setup instructions:
https://beszel.dev/guide/getting-started
At a high level, the setup involves:
- Deploying the hub (the dashboard application) on a server you control, typically via Docker.
- Installing the agent on each system you want to monitor, also available as a Docker image.
- Connecting each agent to the hub so its metrics show up in the dashboard.
Both the hub and agent ship as Docker images (henrygd/beszel and henrygd/beszel-agent), which is the simplest way to run them. Follow the getting started guide on beszel.dev for exact commands, environment variables, and configuration options, since setup details (ports, tokens, backup targets) are documented there rather than fully spelled out in the README.
Frequently asked questions






Similar to Beszel


