
Prometheus
Prometheus collects time-series metrics from configured targets over HTTP, stores them, and lets you query and alert on them with PromQL.
 Datadog
 New Relic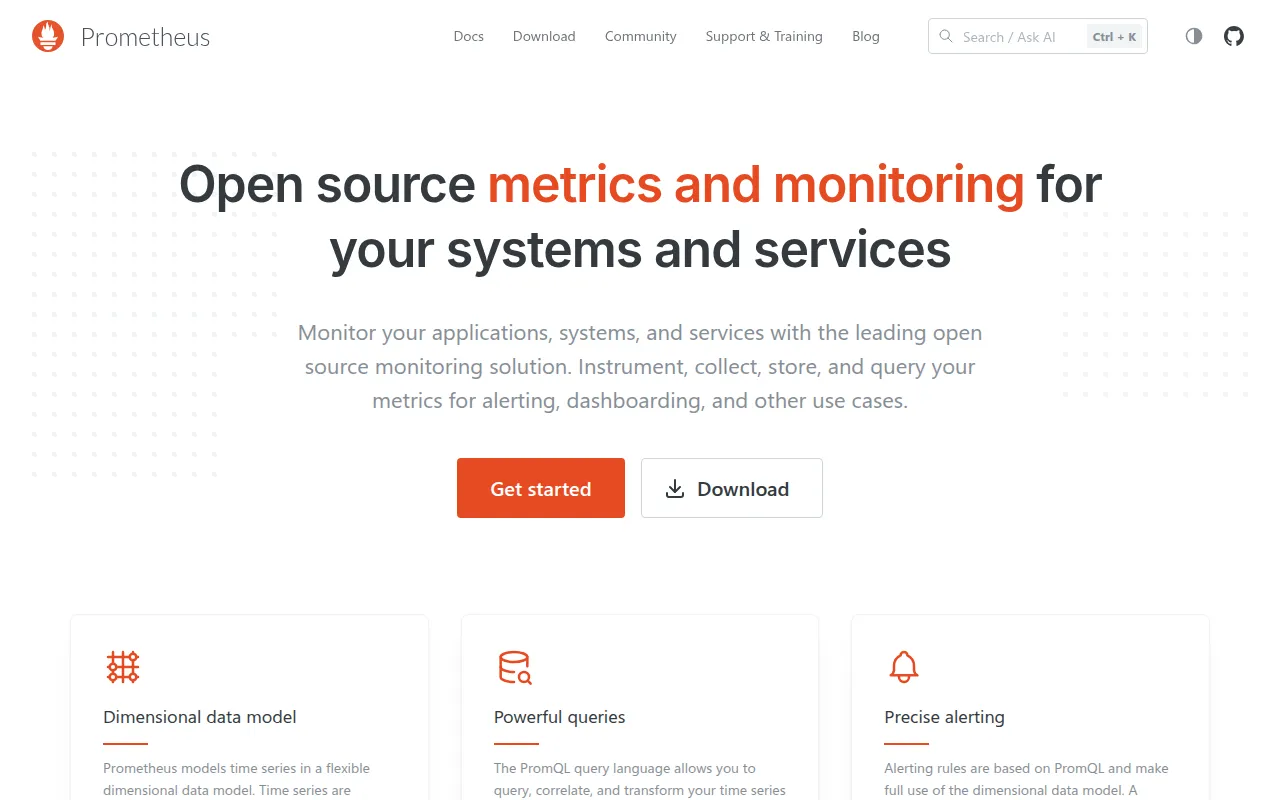
Prometheus is a systems and service monitoring tool that scrapes metrics from configured targets at set intervals, stores them as time series, and evaluates rules against that data to trigger alerts. It was built as a project under the Cloud Native Computing Foundation and is aimed at engineers who run their own infrastructure and want visibility into what's actually happening on their servers and applications, from a single VPS to a large Kubernetes cluster.
Key features
- Multi-dimensional data model: time series are identified by a metric name plus a set of key/value labels, so you can slice and dice data along multiple dimensions.
- PromQL: a dedicated query language built to work with that dimensional data, used for both ad hoc investigation and defining alert rules.
- Pull-based collection: Prometheus scrapes targets over HTTP on a schedule rather than waiting for them to push data, and it can also accept pushed metrics from batch jobs through an intermediary gateway.
- Service discovery: targets can be found automatically through service discovery integrations or declared with static configuration files.
- Autonomous server nodes: each Prometheus server runs independently with no dependency on distributed storage, which keeps the operational model simple.
- Federation: multiple Prometheus servers can be connected hierarchically or horizontally to aggregate metrics across teams or regions.
- Graphing and dashboarding: built-in graphing plus compatibility with external dashboard tools for visualizing collected metrics.
promtoolcompanion binary: ships alongside the main server for validating configuration files, checking rules, and other operational tasks.- Selective service discovery builds: Go build tags let you strip out unused service discovery integrations or keep only the ones you need, which keeps the binary smaller for constrained environments.
Ideal use cases
Prometheus fits teams that manage their own servers, containers, or Kubernetes workloads and need to track resource usage, request rates, error rates, and latency over time. It's a natural choice if you're already running Kubernetes, since much of the surrounding ecosystem (exporters, service discovery, Alertmanager) is built around it. It also works for smaller setups: a single binary with a config file is enough to start scraping and alerting, and the same server can scale up by federating with other Prometheus instances as your infrastructure grows.
It's less suited to teams that want a hosted, no-maintenance metrics platform, since Prometheus itself isn't designed for long-term, distributed storage out of the box (you'd pair it with a remote-write backend for that). It's also not built as a general-purpose logging or tracing system, and the project explicitly does not position itself as a library: internal Go APIs can change between minor releases, so depending on prometheus/prometheus as an imported package rather than a standalone binary comes with real risk. If your priority is a plug-and-play dashboard rather than running and tuning your own monitoring server, a managed service will get you there faster.
Installation
The recommended way to run Prometheus is to grab a precompiled binary from the download page linked in the documentation, or run it as a container.
Quick start with Docker:
docker run --name prometheus -d -p 127.0.0.1:9090:9090 prom/prometheus
This starts Prometheus, reachable at http://localhost:9090/.
To build from source, you need Go (the version specified in go.mod) and Node.js/npm for the React UI:
git clone https://github.com/prometheus/prometheus.git
cd prometheus
make build
./prometheus --config.file=your_config.yml
make build compiles the web assets into the binary so it can run from anywhere. If you use go install instead, Prometheus expects to read web assets from the local filesystem, so you'd need to run it from the repository root and build the React UI separately with make assets.
Prometheus ships with many service discovery plugins built in. You can trim the binary down with Go build tags, excluding all optional service discoveries and re-enabling only the ones you need:
go build -tags "remove_all_sd,enable_kubernetes_sd" ./cmd/prometheus
If you need a local Docker image instead of the published ones, you can build it with:
make promu
promu crossbuild -p linux/amd64
make common-docker-amd64
Note that the make docker target itself is intended only for the project's own CI system.
The Remote Write protobuf definitions are also published independently, so you can pull just that piece as a Go dependency without the rest of the server:
go get buf.build/gen/go/prometheus/prometheus/protocolbuffers/go@latest
The project marks this as experimental.
Tags:
Frequently asked questions






Similar to Prometheus


